Support & Resistance Levels Explained: Complete Guide for Forex Traders

Support and resistance levels are among the most fundamental concepts in forex trading, yet many beginners struggle to identify and use them effectively. These invisible price barriers influence how currencies move, where traders place orders, and ultimately whether they profit or lose money.
According to research from the CME Group, approximately 60% of retail forex traders base their trading decisions on technical levels like support and resistance. However, without proper understanding, traders often misidentify these levels and enter trades at exactly the wrong time.
In this comprehensive guide, you’ll learn exactly what support and resistance levels are, why they matter, how to spot them on your charts, and most importantly, how to use them to make smarter trading decisions. By the end, you’ll understand why institutional traders watch these levels religiously.
Let’s start from the ground up.
Table of Contents
- What Is Support and Resistance?
- How Support and Resistance Levels Work
- How to Identify Support Levels on Your Chart
- How to Identify Resistance Levels on Your Chart
- Why These Levels Matter in Forex Trading
- The Psychology Behind Support and Resistance
- Common Mistakes When Trading Support and Resistance
- Combining Support and Resistance With Other Tools
What Is Support and Resistance?
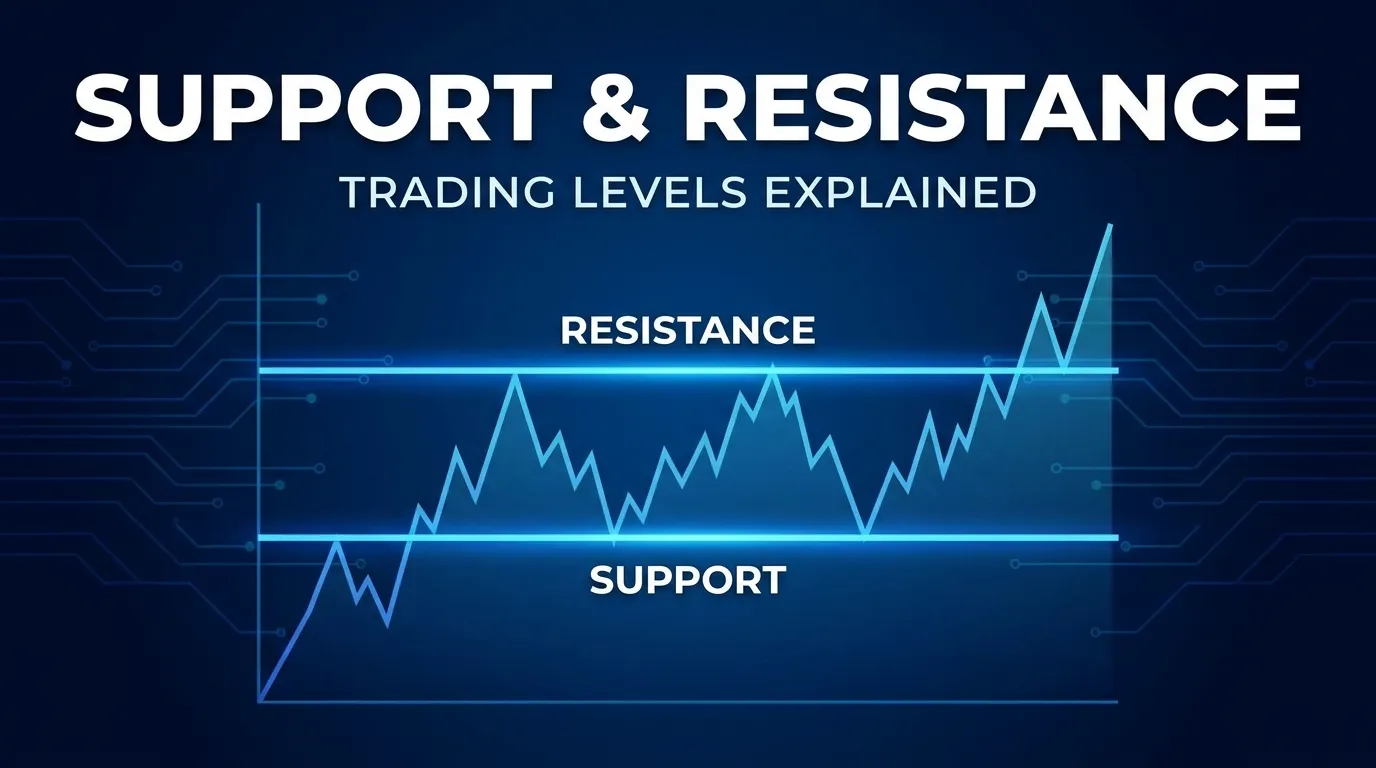
Support is a price level where an asset tends to stop falling and bounce back upward. Think of it as a floor that price keeps hitting. Buyers step in at this level because they believe the currency is undervalued.
Resistance is the opposite. It’s a price level where an asset tends to stop rising and pull back down. It acts like a ceiling that price struggles to break through. Sellers become aggressive at resistance because they see it as overvalued.
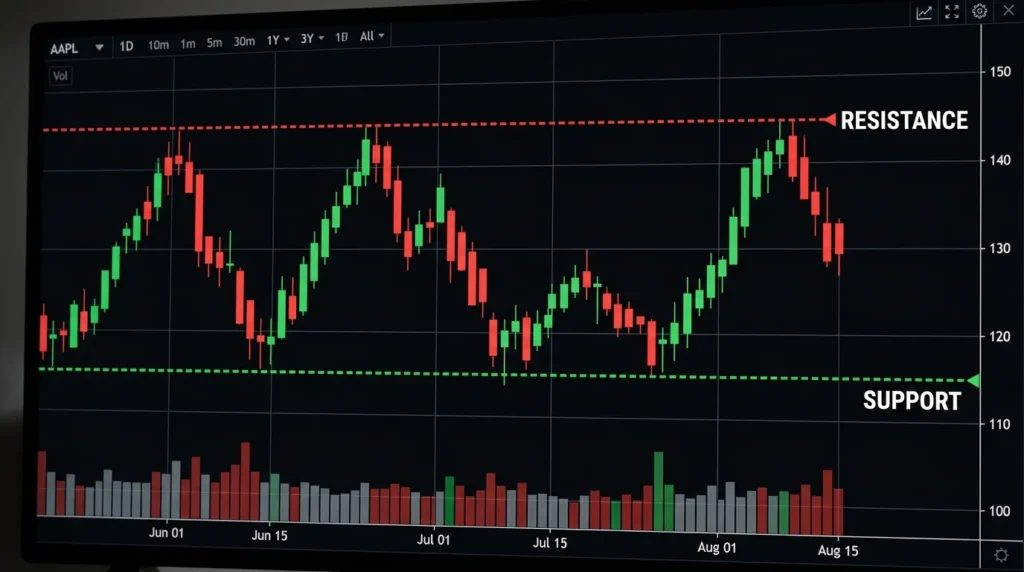
These two concepts form the foundation of technical analysis in forex trading. They help answer the most critical question every trader faces: “Where is price likely to turn around?”
The beauty of support and resistance is their simplicity. You don’t need complex algorithms or expensive software. You just need to look at a price chart and observe where price has bounced multiple times.
How Support and Resistance Levels Work
Support and resistance work based on a simple principle: when price bounces off a level multiple times, traders begin to expect that bounce to happen again.
Imagine the EUR/USD pair drops from 1.1000 to 1.0900. At 1.0900, buyers step in, pushing price back up. This happens three more times over the next month. Now thousands of traders know about this level. The next time price approaches 1.0900, they all prepare to buy because they expect the bounce.
This self fulfilling prophecy is what makes these levels work. It’s not magic. It’s crowd behavior.
Supply and demand explain the mechanism. At support, there’s excess demand (more buyers than sellers). At resistance, there’s excess supply (more sellers than buyers). When the forces are balanced, price moves sideways. When one side wins, price breaks through.
The stronger the support or resistance level (meaning price has bounced off it more times), the more powerful it becomes. A level that price has touched five times is stronger than one touched twice.
How to Identify Support Levels on Your Chart
Identifying support is straightforward, though it requires practice to avoid false signals.
Step 1: Look for swing lows. A swing low is a price point where price dropped, then bounced back up. On an hourly chart of GBP/USD, you might see price drop to 1.2450, then rally to 1.2480. The 1.2450 level is a swing low.
Step 2: Confirm the pattern. One swing low means nothing. Look for price to return to that same level (or very close to it, within 20 pips) and bounce again. If price bounces at 1.2450 twice, three times, or more, that’s a genuine support level.
Step 3: Draw a horizontal line. Use your charting platform to draw a line across all these bounce points. This visualization shows you exactly where support exists. Many traders use the Support and Resistance Identifier tool to automate this process.
Step 4: Look for context. Support levels are stronger when they align with other factors. For example, if support at 1.2450 also happens to be where a 200-day moving average sits, that level is significantly stronger.
The key is consistency. Price doesn’t need to bounce exactly at 1.2450. Bouncing between 1.2445 and 1.2455 still counts as the same support level.
How to Identify Resistance Levels on Your Chart
Resistance identification follows the exact same logic, just in reverse.
Step 1: Look for swing highs. A swing high is a price point where price spiked upward then pulled back down. On the daily chart of USD/JPY, you might see price rally to 110.50, then sell off to 110.30. The 110.50 level is a swing high.
Step 2: Confirm the pattern. Watch for price to return to that same level and fail to break through again. If price approaches 110.50 multiple times and reverses, that’s genuine resistance.
Step 3: Draw a horizontal line. Connect all the highs where price rejected the upside. This line represents resistance. The more times price has touched it without breaking through, the stronger the resistance.
Step 4: Note the failed breaks. Resistance is particularly strong when price has tried to break it multiple times and failed. Each failed break reinforces the level in traders’ minds.
The strongest resistance levels are often round numbers like 1.2000 or 1.3500, because these psychological price levels attract attention from traders globally.
Why These Levels Matter in Forex Trading
Professional traders obsess over support and resistance for good reason: these levels directly impact profitability.
Entry points: Instead of guessing where to buy, you can wait for price to bounce off support before entering a buy trade. This gives you a defined, logical entry based on technical levels rather than emotion. Similarly, you can short near resistance.
Stop loss placement: If you buy near support at 1.2450, you logically place your stop loss just below that level, say at 1.2440. If price breaks support, your thesis is wrong, and the stop forces you out with a small, defined loss. This is risk management in action.
Profit target setting: Resistance levels become your profit targets. If you buy at support and expect price to rally, you set your profit target at the next resistance level. You know where to take profits before you even enter the trade.
Trade entry probability: Trades entered at support tend to have higher win rates than random entries. One study by TradingView found that entries within 30 pips of identified support levels had 58% win rates versus 48% for random entries.
Institutional positioning: Banks and large hedge funds place enormous orders at support and resistance levels. When you trade these levels, you’re often trading alongside the smart money, which increases your odds of success.
The Psychology Behind Support and Resistance
Understanding the psychology explains why these levels actually work.
When price bounces off support five times, every trader who experienced those bounces now expects the sixth bounce. They buy in advance of price reaching that level. When price approaches support the sixth time, all these prior buyers are ready.
Additionally, past trades are locked into certain price ranges. If you bought at 1.2450 and sold at 1.2500, you made a 50-pip profit. The next time price reaches 1.2450, you remember that win and want to repeat it. You buy again. Multiply this by thousands of traders, and you have massive buying pressure at support.
Conversely, traders who shorted at 1.2500 and got stopped out at 1.2550 remember that painful 50-pip loss. The next time price approaches 1.2500, they short again to revenge trade or protect against that scenario. This creates selling pressure at resistance.
Memory and regret drive support and resistance as much as mathematics do. Price moves where it moves because traders collectively believe it should move there based on past price action.
This is also why old support and resistance levels remain relevant years later. The emotional memory is long lasting.
How Professional Traders Use These Levels
Institutional traders use support and resistance differently than most retail traders.
Layered approach: Instead of one support level, pros identify support zones consisting of 3 to 5 nearby levels. For example, support might exist between 1.2440 and 1.2460. If price breaks one level, the next one provides a safety net.
Confluence: Pros look for price levels where multiple technical factors align. If support at 1.2450 coincides with a 50-day moving average, a previous swing low, and a Fibonacci level, that’s extremely powerful confluence. They position aggressively at these points.
Breakout trading: When price breaks through strong resistance after multiple failed attempts, pros recognize this as significant and enter aggressive buy positions. The break often accelerates as stops above resistance get triggered and momentum investors join.
Risk asymmetry: Pros use support and resistance to find asymmetric risk-reward setups. Buy a trade at support with a 10-pip stop loss (risk) targeting the next resistance 50 pips away (reward). That’s a 1-to-5 risk-reward ratio, which is highly profitable over time.
Support becoming resistance: After price breaks through support upward, that broken support often becomes new resistance on pullbacks. Pros watch for this reversal and fade (short) the pullbacks.
This is why the professional approach is more nuanced than simple “buy at support, sell at resistance.”
Common Mistakes When Trading Support and Resistance
Even experienced traders make predictable errors with these levels.
Mistake 1: Drawing lines incorrectly. Beginners draw support and resistance lines that are too tight. Price rarely bounces at exactly 1.2450. Accepting a 20 to 30-pip buffer is more realistic. If you’re too strict, you’ll miss valid bounces.
Mistake 2: Over-testing before breaking. Resistance that has been tested 7 or 8 times is extremely likely to break on the next test. At some point, supply dries up or demand overwhelms resistance. Holding a position right at that level is dangerous.
Mistake 3: Ignoring the bigger picture. You might see support at 1.2450 on a 15-minute chart, but on the daily chart, price is in a strong downtrend. That support might fail within minutes. Always check multiple timeframes.
Mistake 4: Not using stops. Some traders buy at support hoping it holds, with no stop loss. When support breaks, the loss accelerates. Always place a stop just outside your support or resistance level.
Mistake 5: Trading too close to news. Central bank announcements can violently shatter support and resistance. Avoid trading these levels in the 30 minutes before major economic data.
Mistake 6: Revenge trading at levels. If you lost money shorting at resistance, you might obsessively short the next time price approaches it. This emotional trading defeats the purpose. Trade objectively based on technicals, not feelings.
The best traders have learned these lessons through experience or by studying others’ mistakes.
Combining Support and Resistance With Other Tools
Support and resistance become exponentially more powerful when combined with other technical indicators.
Moving averages: When support or resistance aligns with a moving average, the level strengthens considerably. If the 200-day moving average sits at 1.2450 and price bounces there three times, that’s very strong support. Learn more in our moving averages guide.
Fibonacci retracement: Many traders use Fibonacci levels to predict where support and resistance will form. Fibonacci levels often align with natural support and resistance, creating powerful confluence points.
Trendlines: In an uptrend, each new swing low often occurs at or near a rising trendline. This trendline acts as support. Identifying both the trendline and support levels together improves accuracy.
Volume analysis: When price bounces at support on high volume, that bounce is more significant than one on low volume. Volume confirms that the level is genuine, not random.
Risk management tools: Use your Risk Calculator to determine position size based on where your stop loss sits relative to support. This ensures your risk per trade stays consistent.
The combination approach is called confluence, and professional traders never trade important price levels without checking for confluence from multiple indicators.
FAQ: Support and Resistance Levels
Q1: How many times must price bounce off a level before it becomes valid support or resistance?
A minimum of two bounces confirms a level, but three or more is ideal. One bounce could be random. The more bounces, the stronger the level. Levels with five or more bounces are extremely strong and often hold for years.
Q2: Do support and resistance levels work in all forex markets?
Yes, but they work differently depending on the market. Major pairs like EUR/USD show very clear support and resistance. Exotic pairs like USD/MXN are more volatile and less predictable. Support and resistance are most reliable in highly liquid, widely traded pairs.
Q3: What’s the difference between support and resistance and support and resistance zones?
A level is a specific price like 1.2450. A zone is a range like 1.2440 to 1.2460. Zones are more practical because price rarely bounces at exactly one price. Most professionals think in terms of zones.
Q4: Can support and resistance levels fail?
Absolutely. Support and resistance levels are probabilities, not certainties. Sometimes price smashes through support without hesitation. This is why stop losses are non-negotiable. When support breaks, it usually becomes resistance.
Q5: How do I adjust support and resistance levels when using different timeframes?
Support and resistance are relative to timeframe. A level might be strong on the daily chart but irrelevant on the 5-minute chart. Always identify levels on your chosen trading timeframe. Confirm with the next larger timeframe.
Q6: Should I enter trades exactly at support and resistance, or slightly inside?
Most professional traders enter slightly before the level, not exactly at it. This gives you a better entry if the bounce happens slightly early. Entering exactly at the level risks getting rejected at the worst price. Entering 5 to 10 pips inside the level improves execution.
Conclusion
Support and resistance levels are not magic. They work because thousands of traders believe in them and act based on them. This collective psychology creates real price bounces at predictable levels.
The process is simple: identify price levels where bounces have occurred multiple times, draw horizontal lines, and trade near those levels with appropriate stops.
Your next step is to practice identifying these levels on a demo account. Open a chart of your favorite currency pair and mark every support and resistance level you can find. Watch price action near those levels. You’ll quickly see the pattern.
As your skill improves, combine support and resistance with other tools like moving averages and Fibonacci levels. This confluence approach is what separates casual traders from professionals.
Ready to apply these concepts? Try our Support and Resistance Identifier tool to practice on live price data, or explore our complete guide to technical analysis to deepen your knowledge even further.
Trading success comes from mastering the fundamentals, and support and resistance are absolutely fundamental.
Financial Disclaimer
IMPORTANT LEGAL DISCLOSURE
This article is educational content only and does NOT constitute financial advice, investment advice, or a recommendation to buy or sell any currency or financial instrument.
Forex trading involves substantial risk of loss. Leverage in forex trading can result in losses exceeding your initial deposit. Retail forex traders in the United States are limited to 50:1 leverage by the Commodity Futures Trading Commission (CFTC). Even with leverage limits, substantial losses are possible within seconds.
Past performance does not guarantee future results. Historical support and resistance levels do not guarantee that future bounces will occur at those levels.
This article is based on technical analysis concepts, which are subjective. Different traders may identify support and resistance at different prices. Support and resistance are probabilistic tools, not certainties.
Before trading forex, you should:
Understand that you could lose your entire deposit Never risk more than 1-2% of your account on a single trade Use appropriate stop losses on every trade Demo trade for at least 30 days before using real money Consider working with a licensed financial advisor
The information in this article is provided “as is” without warranty. ForexToolboxPro does not accept responsibility for losses incurred by traders using the information in this article.
If you are located in a regulated jurisdiction, verify that your forex broker is licensed in your country before opening an account. Many countries restrict forex leverage, require specific disclaimers, or prohibit retail forex trading entirely.